
Author: Ali Hasanbeigi, Ph.D., Cecilia Springer, Dinah Shi

World aluminum production has more than doubled between 2000 and 2020. Much of this growth in production came from China, which accounted for 57 percent of global aluminum production in 2020.
The energy use and greenhouse gas (GHG) emissions of the aluminum industry are likely to continue increasing because the increased demand for aluminum, particularly in developing countries, is outpacing the incremental decreases in energy and CO2 emissions intensity of aluminum production that are happening under the current policy and technology regime.
We have conducted a benchmarking study for energy and CO2 emissions intensity of the aluminum industry among the largest aluminum-producing countries. We focused on the two phases of aluminum production value chain responsible for the vast majority of energy use and associated CO2 emissions: alumina production and the electrolysis process to produce aluminum.
[The full report of this study titled “Aluminum Climate Impact - An International Benchmarking of Energy and CO2 Intensities” will be released in mid-February 2022.]
Based on the final estimated CO2 intensity for the 11 countries covered in this study, we estimate the total CO2 emissions from aluminum production in these countries (Australia, Bahrain, Canada, China, Iceland, India, New Zealand, Norway, Russia, the United Arab Emirates, and the United States). We calculated a production-weighted average emissions intensity for these 11 countries. We find that the aluminum industry in these 11 countries emitted 597 million tonnes (Mt) of CO2 in 2019. This only includes energy-related emissions and not the process-related emissions. These 11 major aluminum-producing countries represented 86 percent of total world aluminum production. Assuming the rest of the world produced aluminum with the average CO2 emissions intensity of the countries in this study, then total global energy-related CO2 emissions from aluminum production in 2019 would be 663 Mt CO2.
We also estimate the total CO2 emissions from each of the countries studied, based on our estimated CO2 intensity by country and the amount of production in each country. Figure 1 shows the results of this analysis, with China standing out as responsible for 67% of estimated global CO2 emissions – more than its production share, due to the high CO2 intensity of aluminum production.

Figure 1. Total Energy-Related CO2 Emissions from Aluminum Production in the Countries Studied and Rest of the World in 2019 (Source: Global Efficiency Intelligence’s analysis)
The global aluminum industry’s total energy-related CO2 emissions was around 663 million tonne CO2 in 2019.
Based on the total aluminum industry emissions presented above and the global CO2 emissions of 33 Gt CO2 in 2019 reported by IEA, the global aluminum industry’s energy-related CO2 emissions account for 2 percent of total global CO2 emissions.
It is worth highlighting that if the global aluminum industry represented a country, it would be the 10th largest emitter of annual energy-related CO2 emissions in the world.
For the 11 countries studied, we also estimate the total amount of emissions from fuel and from electricity (Figure 2). Fuel use is almost entirely consumed during the alumina production phase, which also consumes some electricity. We find that 19% of emissions in the countries studied comes from fuel use, while 81% of emissions come from electricity use. This indicates that decarbonization efforts in these countries should be focused on electricity, but that alumina production should also be oriented towards lower carbon fuels and even carbon capture, given the presence of carbon neutrality goals in many of the countries studied.
The fuel vs. electricity mix also ranges from country to country, because some countries, like Iceland and Norway, use essentially zero-emissions electricity for aluminum production, while other countries, like India, use carbon-intensive fuels both for electricity used in the electrolysis phase and alumina production.
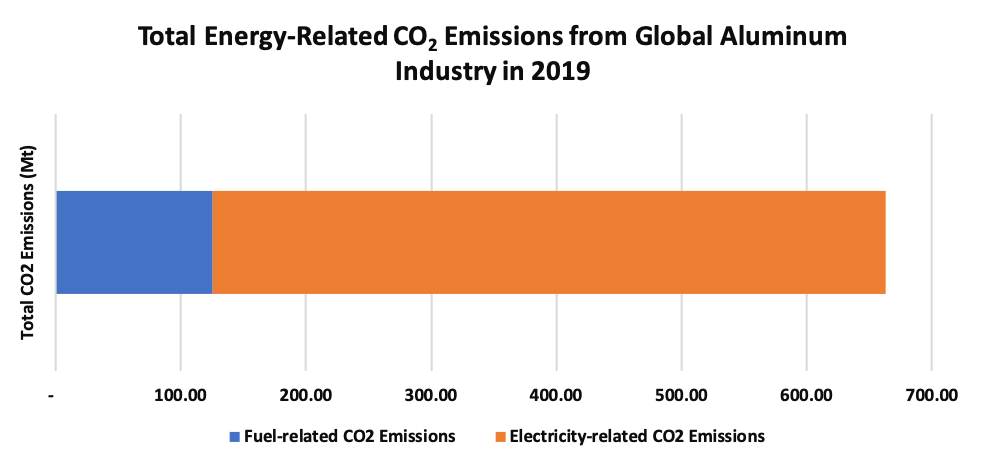
Figure 2. Total Energy-Related CO2 Emissions from Global Aluminum Production (Both Smelters and Alumina Production Processes) by Energy Source in 2019 (Source: Global Efficiency Intelligence’s analysis)