Author: Ali Hasanbeigi, Ph.D.
China is responsible for nearly 20% of global energy use and 25% of global energy-related CO2 emissions. The industrial sector dominates the country’s total energy consumption, accounting for about 70% of primary energy use and also country’s CO2 emissions. For these reasons, the development path of China’s industrial sector will greatly affect future energy demand and dynamics of not only China, but the entire world.
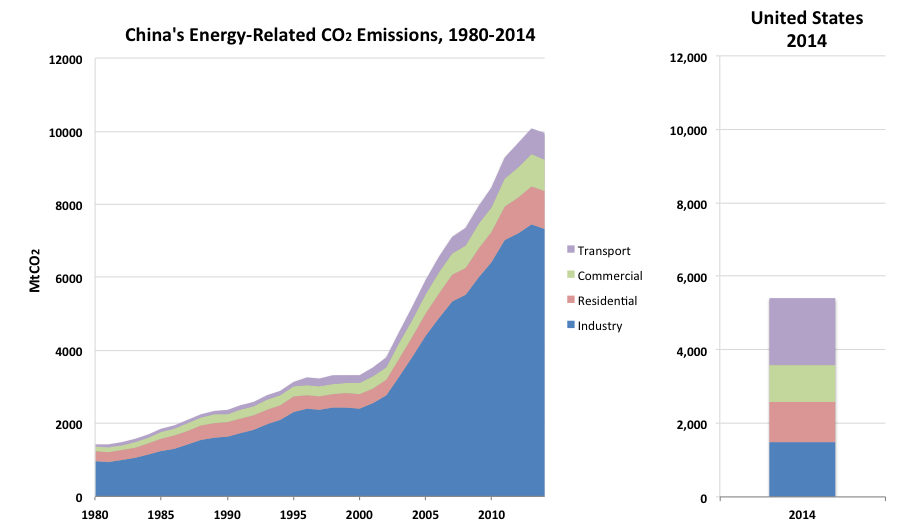
Sources: NBS, China Energy Statistical Yearbooks 2015. EIA, 2015
Steam is used extensively as a means of delivering energy to industrial processes. On average, industrial boiler and steam systems account for around 30% of manufacturing industry energy use worldwide. There exists a significant potential for energy efficiency improvement in steam systems; however, this potential is largely unrealized. A major barrier to effective policymaking, and to more global acceptance of the energy efficiency potential of steam systems, is the lack of a transparent methodology for quantifying steam system energy efficiency potential based on sufficient data to document the magnitude and cost-effectiveness of these energy savings by country and by region.

Source: U.S. DOE/AMO, 2012
In 2013-2014, I led a UNIDO-funded study to develop and apply a steam system energy efficiency cost curve modeling framework to quantify the energy saving potential and associated costs of implementation of an array of boiler and steam system optimization measures. The developed steam systems energy efficiency cost curve modeling framework was used to evaluate the energy efficiency potential of coal-fired boiler (around 83% of industrial boilers) and steam systems in China’s industrial sector. Nine energy-efficiency technologies and measures for steam systems are analyzed.
The study found that total cost-effective (i.e. the cost of saving a unit of energy is lower than purchasing a unit of energy) and technically feasible fuel savings potential in industrial coal-fired steam systems in China in 2012 was 1,687 PJ and 2,047 PJ, respectively. These account for 23% and 28% of the total fuel used in industrial coal-fired steam systems in China in that year, respectively. The CO2 emission reduction potential associated with the cost-effective and total technical potential is equal to 165.82 MtCO2 and 201.23 MtCO2, respectively. By comparison, the calculated technical fuel saving potential for industrial coal-fired steam systems in China is approximately 9% of the total coal plus coke used in Chinese manufacturing in 2012 and is greater than the total primary energy use of over 160 countries in the world in 2010.

Several sensitivity analyses were conducted, their policy implications discussed, and uncertainties and limitations of this study were presented in the report we published. Our report is published by UNIDO and can be downloaded from here. Please feel free to contact me if you have any question.
Don't forget to follow us on LinkedIn, Facebook, and Twitter to get the latest about our new blog posts, projects, and publications.